Online Venue Booking Makes Waves in London Business
Tagvenue, one of the world’s fastest growing online venue hire platforms, is delighted to present a data-driven industry report on meetings and conferences in London. Based on data collected from its digital platform in 2017 and 2018, the study covers trends and insights into online venue booking in the London area. The report separates the findings into two categories: meetings and conferences.
London is the #1 EMEA city for meetings and events. The business events market is growing rapidly, with conferences and meetings generating approximately £18.1 billion of expenditure. So, what is the current state of the corporate events industry in London? What are the 2019 meeting trends?
Read more below to find out!
What’s the difference between meetings and conferences?
As mentioned above, this market study covers meetings and conferences in London separately. The names sound similar, but what are the main differences between these two?
| Meeting | Conference |
| Average of 14 delegates | Average of 75 delegates |
| Booked about 19 days in advance | Booked about 75 days in advance |
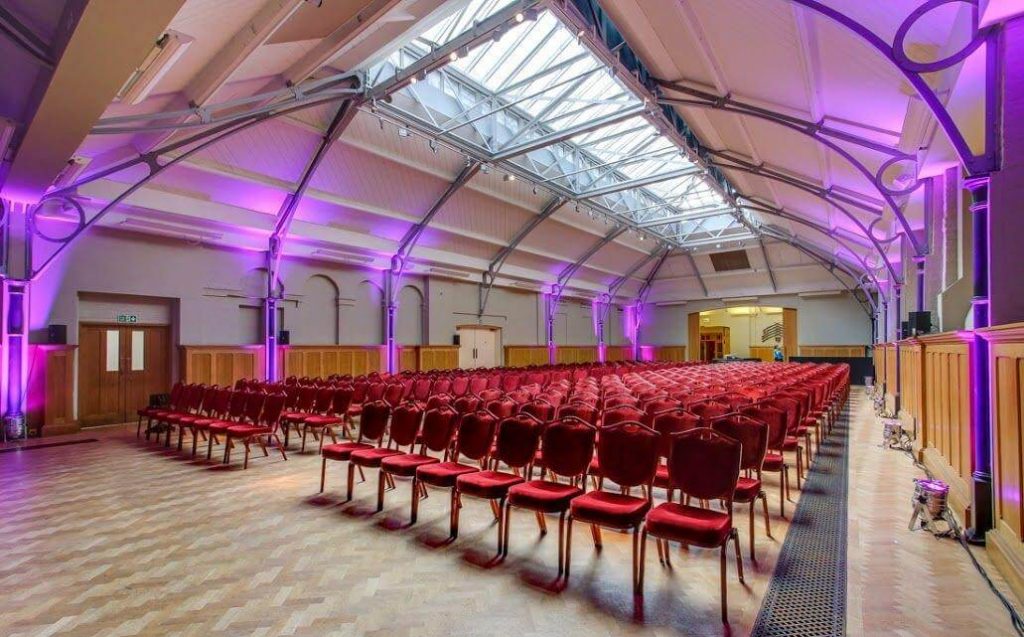
| Standard boardrooms, classrooms, quirky hotels and converted venues | University lecture theatres, contemporary hotel suites and industrial-type versatile venues |
So, where does the money go? The data speaks for itself:
Meetings | London-based businesses spent 20% less per person on meetings in 2018
Costs


The average daily delegate rate decreased by 20% year-on-year from 58.28 GBP to 46.50 GBP.
On the other hand, the average spend per meeting remained virtually the same, decreasing only by 1.9% from 670.88 GBP in 2017 to 657.77 GBP in 2018.
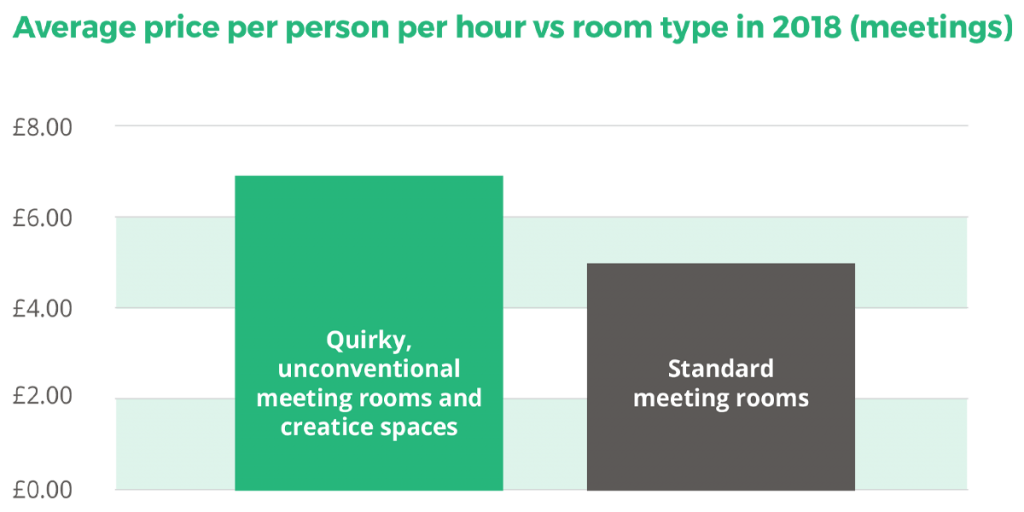
The average hourly rate for an unconventional meeting room is slightly higher than for a traditional one. Quirky meeting rooms vary highly in pricing – some are more affordable, others are very expensive. Standard meeting rooms are usually affordable or averagely priced.
Size
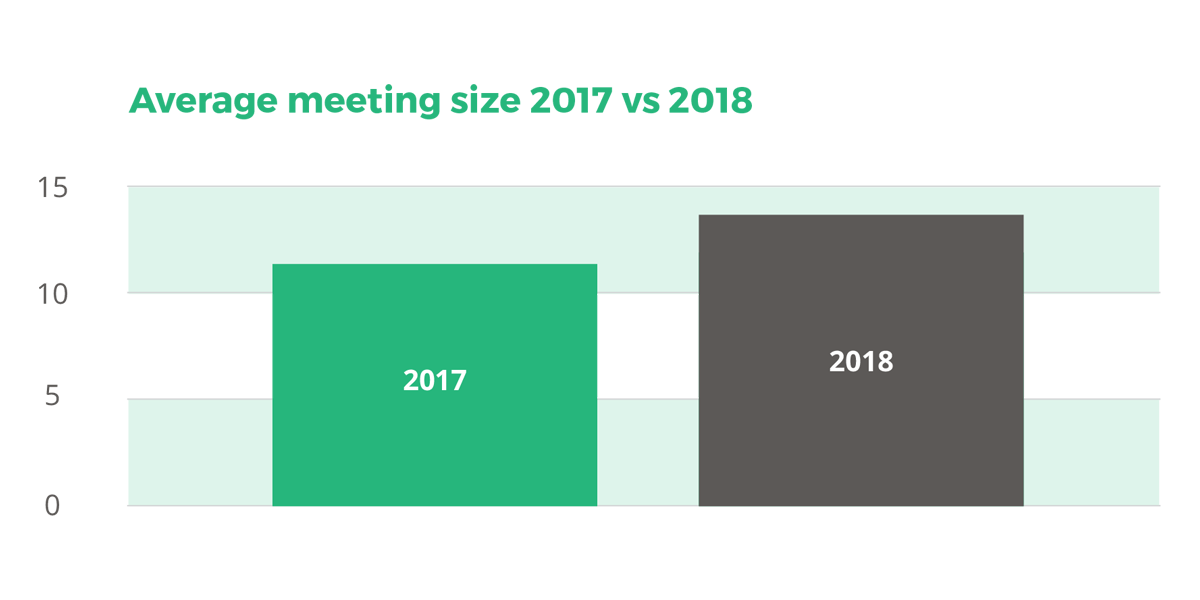
The average size of meetings increased by 16% from 12 delegates in 2017 to 14 in 2018.
Locations
The most popular London districts for meetings in 2018 included: the City of London, Kensington, Fitzrovia, Farringdon, Spitalfields, Bermondsey, Shoreditch, Bethnal Green, Kings Cross and Belgravia.
Have a look at our interactive heatmap with the most popular meeting locations in London to see more details:

Timings
The most popular days of the week for meetings in 2018 were Thursdays, followed by Wednesdays and Tuesdays.

Trends
53.8% of meeting rooms booked in 2018 were categorised as quirky, unconventional and creative spaces, while 46.2% were considered standard meeting rooms.

Which types of meeting spaces were popular in London? Here’s a short list of the most sought-after kinds:
Unconventional spaces

The Bedouin Tent at 78 Bishopsgate (St. Ethelburga’s) 
Sunnyvale at Huckletree Shoreditch 
The Terrace at The Collective Venues – Bedford Square


Affordable, standard meeting rooms

Quirky hotel meeting rooms


Flexible creative spaces

Whole Venue at The LBA LAB The Library – Meeting Space at Stillpoint Spaces London Studio 249 at Liberté Concept


Will the same tendencies be visible in 2019 meeting trends? We are yet to know – stay tuned!
Conferences | Bigger events, bigger budgets, steady spend per conference delegate
Costs

The average spend per conference increased by 20% year-on-year from 2798.27 GBP in 2017 to 3355.83 GBP in 2018. This is in line with the overall UK trend.
Tagvenue Co-founder and CEO Arthur Stepaniak commented:
This proves that London remains a global hub for larger gatherings of 100+ attendees. Another reason for the increase in spend is that business events are getting bigger. Venues are elevating their standards and prices to accommodate higher and more sophisticated demand.
Arthur Stepaniak, CEO & co-founder of Tagvenue
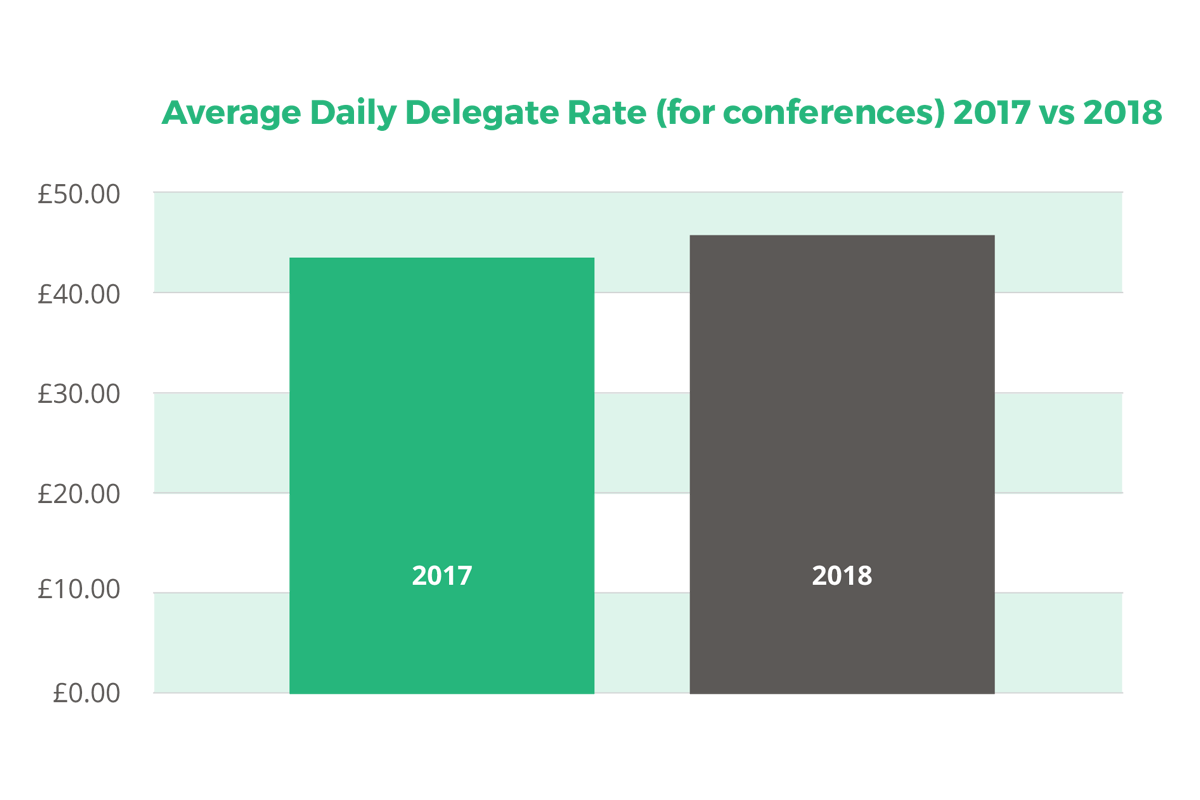
In terms of the average spend per conference delegate, the figure only rose 3% year-on-year from 44.53 GBP to 46.16 GBP. Given that the inflation rate in the UK is around 3% per year, this corresponds with overall price increases.
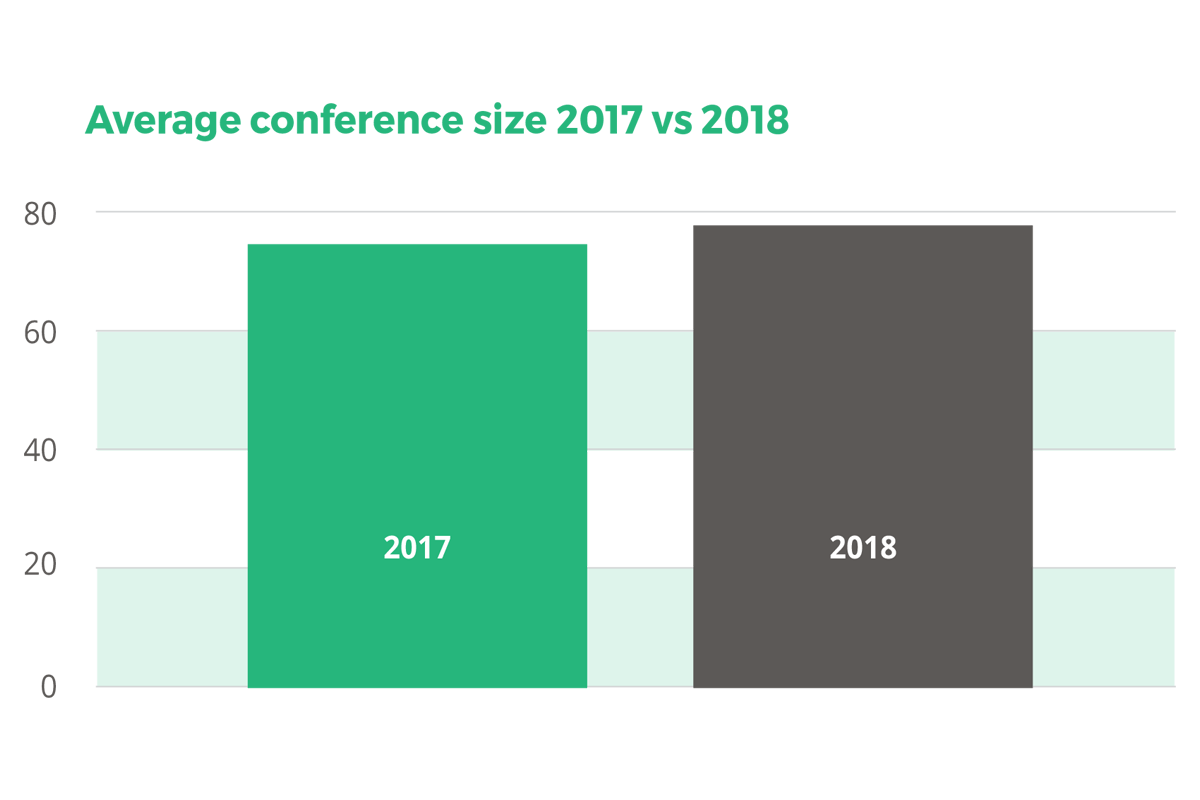
Size
Locations

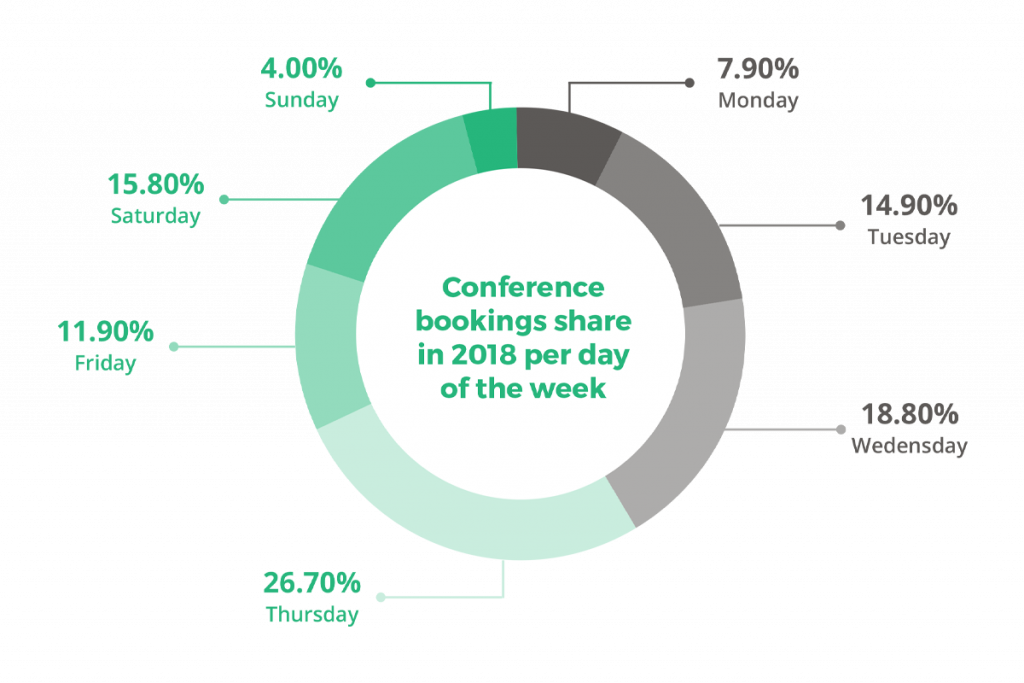
Timings
The most popular days of the week for conferences in 2018 were Thursdays, followed by Wednesdays and Saturdays.
Trends
As with meetings, London conference organisers are likewise tending towards alternative and budget-friendly venues. Spaces outside of the usual business hotspots are also in demand, including such areas as South Kensington and Notting Hill.

In 2018, the most popular venue types for conferences in London included:
University lecture theatres

Contemporary hotel suites


Industrial-type versatile venues

The Loading Bay at Techspace Shoreditch Private Room at Sink 
Prudential Hall at China Exchange UK


Grade II listed buildings

Conclusion
So, what’s the single most important takeaway of this report?
Digital services and platforms like Tagvenue are becoming valuable tools for booking business events. It’s a handy way to eliminate third-party costs for conference organisers and contractors. Looking for something quirky to impress? Unconventional meeting rooms and unique conference venues that may otherwise go unnoticed can now list their offers for all to see.
Want to make the most of your budget?
Online you can find some of the best hire deals for meetings and conferences in London. Browse a wider range of venue options and book directly in just a few clicks when you find the right one. The impact on business is win-win.
Note on data collection:
All data in this report is for the London area based on enquiries and bookings for meetings and conference events through the Tagvenue platform from 1 January 2017 through 31 December 2017, and from 1 January 2018 through 31 December 2018.
You might also like
London Meetings & Conferences Report 2019
Top 13 Meeting Rooms with a View in London
How to choose a conference venue

Organising a Successful Meeting: Checklist
4 ideas on how to plan a product launch